UP TO THE MINUTE






5 Steps to Achieving Optimal Results With Your Drone Data
By Evelyn Witterholt.
Using this five-step process will help you gain valuable insight into your drone data results.
Drone inspections have become quite commonplace in the construction industry. Using an unmanned aerial vehicle (UAV) can help companies save money on inspections and get more accurate data. But if you have a drone asset inspection program yet aren’t sure how to get the most out of your data, Imagine Technologies and Optelos have released their helpful eBook, 8 Ways to Optimize Drone Asset Inspections.
In the eBook, they include a five-step process for you to follow that will help you get the most out of your drone data. The five steps are:
Step 1 - Identify the desired objectives of your drone program
Before you even begin grabbing drone data, you want to have a big picture idea of what it is you are looking for. Are you looking to improve employee safety by having a drone tackle their more dangerous jobs? Do you want the drones to reduce the cost of inspections? Are you looking for any specific improvements in whatever site you are having the drone examine? By having an idea of what you are looking to get out of with your drone data, then you can proceed with your visual asset management program.
Step 2 - Select the right drone sensor type and data collection method for your objectives
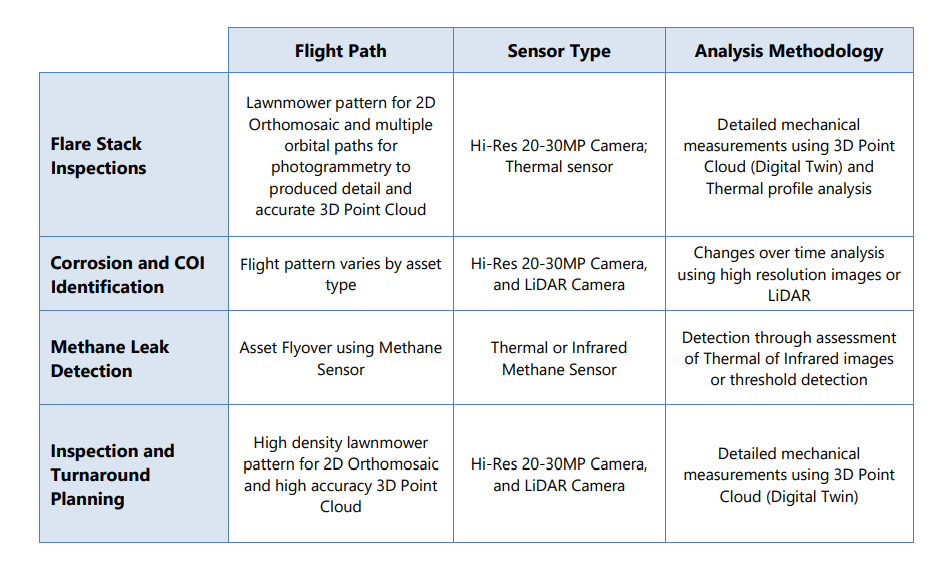
Depending on what you are measuring, you need to determine what type of drone sensor and data collection method will best fit your program. In the eBook, Imagine Technologies offers this handy table you can follow to determine what flight path, sensor type and analysis methodology will work best for your needs:
Step 3 - Utilize the data type best suited for the defined objective
The data type you end up using will determine how impactful your results will be. There are three main types of data: Thermal imagery, LiDAR and photogrammetry. Thermal imagery is great for identifying temperature variations and pipeline and hydrocarbon leaks. LiDAR and photogrammetry are good for inspecting pipelines or flare stacks for corrosion and dimensional variations. This is why determining what you want your data to tell you is important, because that will decide the type of data that you need.
Step 4 - Employ the right data analysis methods that match your objectives
Once you’ve decided the capturing method you’ll use and the type of data you want, then you can know how to analyze the data you’ve captured. If your drone has captured 3D point clouds of an asset, you can use this data to determine issues with the asset without the need for cranes or scaffolding. 2D orthomosaic model maps are overhead views of a site and can be used to get a bigger look at a location. You can also use these 2D maps to look at changes in elevation or vegetation.
Step 5 - Integrate dispatch into the overall workflow
Once you have this program in place, you want to find a way to get this data into the hands of people who can solve any problems that come up with the findings. You’ll want to create a dispatch or trouble ticket system that gets the necessary data to your inspection and repair team, that way they fix the issues found in a timely manner. Doing so will show that the data being gathered is helping your company improve how they go about making repairs, thereby improving your company in the future.
Learn more about the Imagine Technologies Group in their RoofersCoffeeShop® Directory or visit www.imaginetechnologiesgroup.com.
About Evelyn
Evelyn works as a writer for RoofersCoffeeShop, MetalCoffeeShop and AskARoofer. When she isn’t writing about roofing, she’s either at the gym lifting weights or curled up on the couch watching a movie.
Recommended For You

How AI is reshaping contractor search
Read More ...
Is your Website in Need of a Repair?
Read More ...
Optimize your roofing material ordering process
Read More ...
UP TO THE MINUTE
Comments
Leave a Reply
Have an account? Login to leave a comment!
Sign In